Betashares Global Sustainability Leaders Fund (NZD Hedged)
- International shares
Overview
Fund objective
The Fund aims to track the performance of an index (before fees and expenses) that includes a portfolio of large global stocks identified as ‘Climate Leaders’ that have also passed screens to exclude companies with direct or significant exposure to fossil fuels or engaged in activities deemed inconsistent with responsible investment considerations, with the currency exposure hedged back to the NZ dollar.
Benefits
-
True-to-label
The Fund combines positive climate leadership screens with a broad set of ESG-criteria, offering investors a true-to-label ethical investment solution.
-
Diversified global exposure
The Fund holds a diversified portfolio of large, sustainable, ethical companies from a range of global locations.
-
Currency-hedged
The Fund is currency-hedged to the NZ dollar, which seeks to minimise the effect of currency fluctuations on returns.
There are risks associated with an investment in the Fund, including market risk, international investment risk, non-traditional index methodology risk and foreign exchange risk. Investment value can go up and down. An investment in the Fund should only be made after considering your particular circumstances, including your tolerance for risk. For more information on risks and other features of the Fund, please see the Product Disclosure Statement, SIPO and OMI available on this website.
Risk indicator
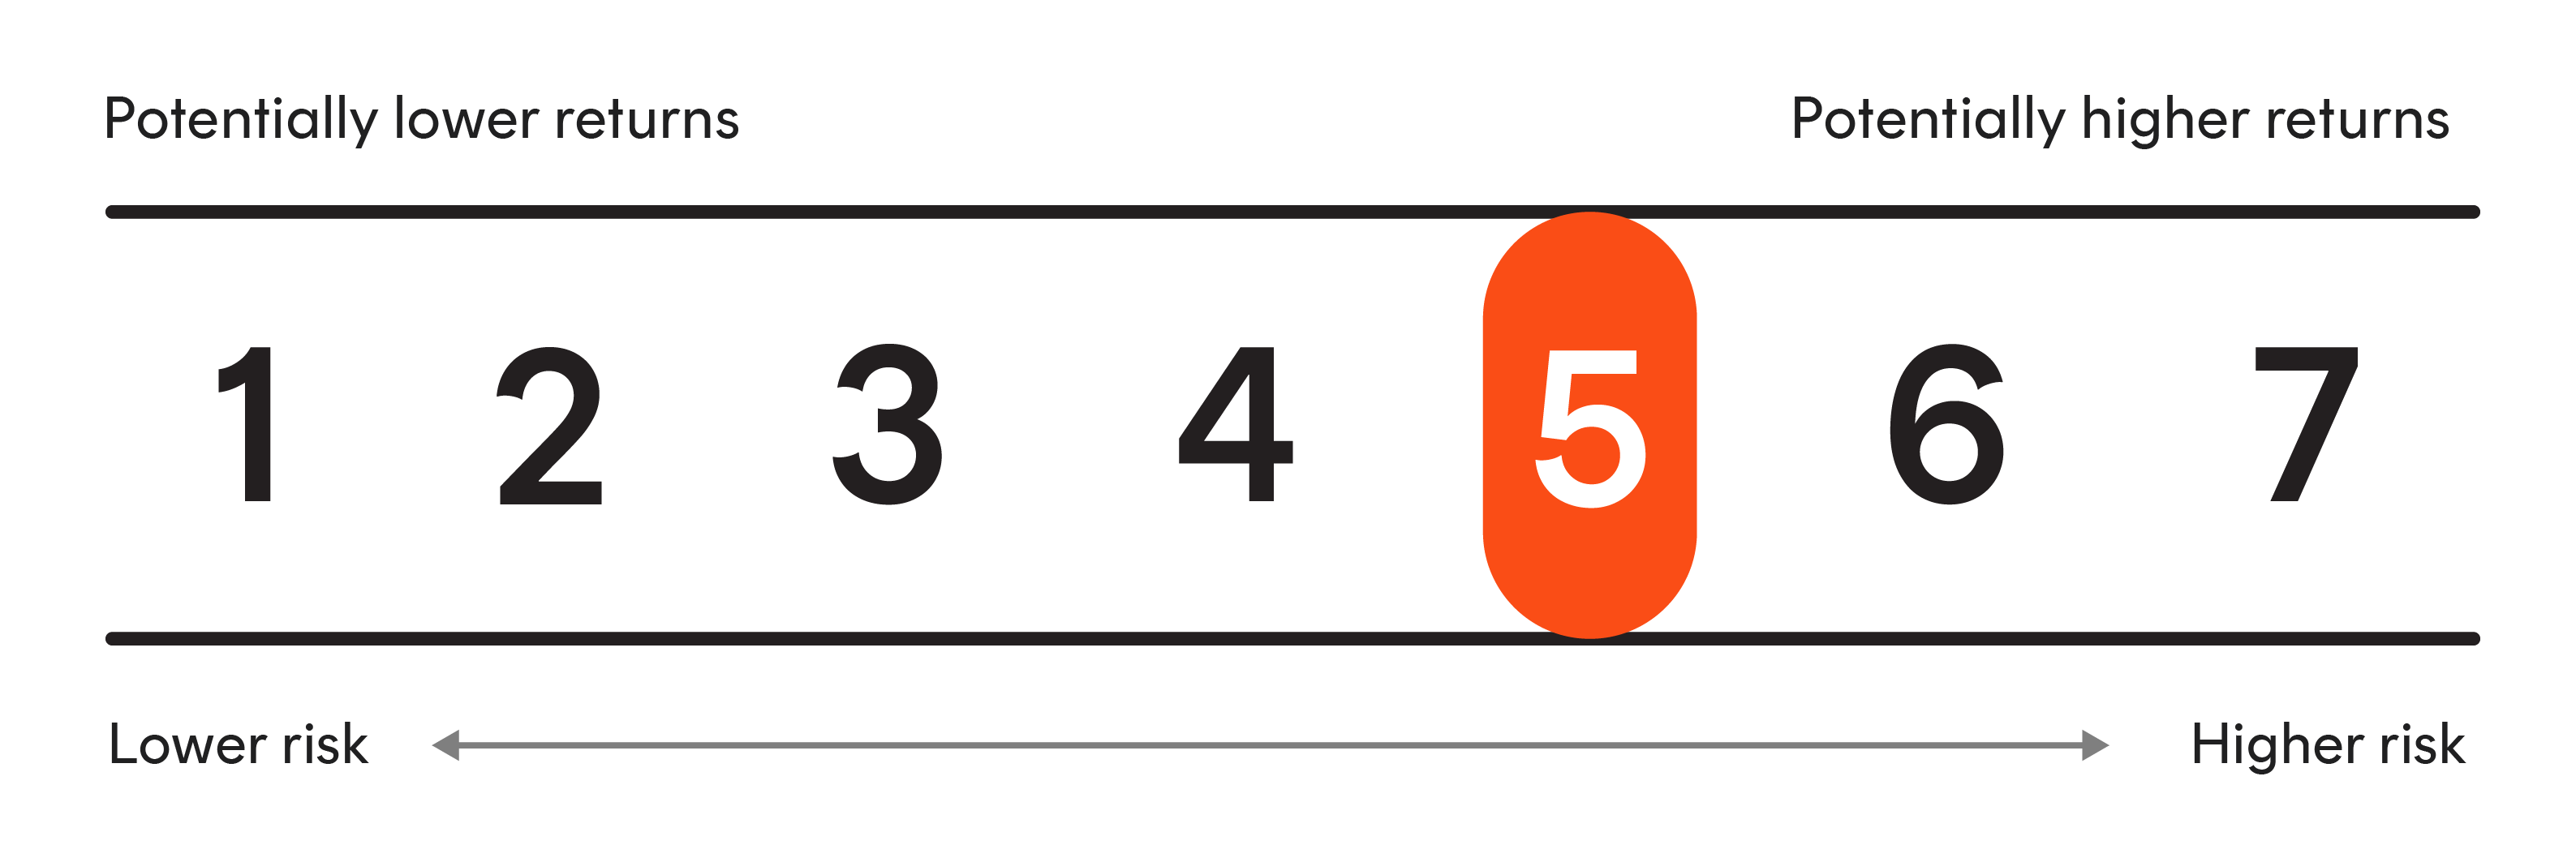
The Fund is expected to have a very high level of volatility. See the PDS for more information regarding the risk indicator.
How to invest
- You can invest in Betashares NZ funds through an approved platform
- Contact us to enquire about direct applications (minimum investment ($500,000)
|

Key facts
Profile
| NAV / Unit | $1.4498 |
|---|---|
| Net assets ($NZ) | $49,002,294 |
| Annual Fund Charges | 0.79% |
| Buy/Sell spread | 0.16%/0.16% |
| Investment manager | Betashares Capital NZ Ltd |
| Distribution frequency | N/A |
| Distribution reinvestment plan (DRP) | N/A |
| Registry | MUFG Corporate Markets |
| Supervisor | Trustees Executors Limited |
* As at 16 June 2026
* As of close of previous day**Certain additional costs apply. Please refer to PDS.
Index information
| Index | Nasdaq Future Global Sustainability Leaders Currency Hedged NZD Index |
|---|---|
| Index provider | Nasdaq |
| Index ticker | |
| Bloomberg index ticker | NQGSLNZN Index |
Holdings & allocation
Portfolio exposure
| Name | Weight (%) |
|---|---|
| BROADCOM INC | 4.5% |
| NVIDIA CORP | 4.1% |
| APPLE INC | 4.1% |
| ASML HOLDING NV | 4.1% |
| VISA INC | 3.9% |
| MASTERCARD INC | 3.4% |
| HOME DEPOT INC/THE | 3.1% |
| TOYOTA MOTOR CORP | 2.8% |
| ELI LILLY & CO | 2.5% |
| APPLIED MATERIALS INC | 2.4% |
* As at 17 June 2026.
As described in the PDS, the Fund may either invest directly, via another Fund and/or via an underlying exchange traded fund (ETF). The information above shows either the direct holdings of the Fund or the holdings of the underlying Fund/ETF on a look through basis which closely approximates the Fund’s percentage exposure to those investments.
Index sector exposure
| Information Technology | 34.0% |
|---|---|
| Financials | 27.0% |
| Health Care | 13.0% |
| Consumer Discretionary | 11.9% |
| Industrials | 7.1% |
| Real Estate | 3.4% |
| Communication Services | 2.7% |
| Materials | 0.5% |
| Utilities | 0.1% |
| Consumer Staples | 0.1% |
* As of 29 May 2026
Index country exposure
| United States | 70.0% |
|---|---|
| Japan | 9.2% |
| Netherlands | 4.8% |
| Germany | 2.8% |
| Switzerland | 2.8% |
| Canada | 2.7% |
| France | 1.4% |
| Britain | 1.4% |
| Denmark | 1.3% |
| Other | 3.7% |
* As of 29 May 2026
Performance
Fund returns after fees (%)
| Fund | Index | |
|---|---|---|
| 1 month | 5.00% | 5.11% |
| 3 months | 6.18% | 6.42% |
| 6 months | 5.29% | 5.72% |
| 1 year | 14.93% | 15.89% |
| 3 year p.a. | - | 16.48% |
| 5 year p.a. | - | 8.69% |
| 10 year p.a. | - | - |
| Since inception | 15.27% | 16.26% |
| Inception date | 21-Nov-23 | - |
* As at 29 May 2026.
Past performance is not an indicator of future performance. Returns are calculated in New Zealand dollars using exit unit prices at the start and end of the specified period. Returns are after fund management costs, assume reinvestment of any distributions and do not take into account tax paid as an investor in the Fund. Returns for periods longer than one year are annualised. Current performance may be higher or lower than the performance shown.
Chart
Past performance is not indicative of future performance. Please refer to "Fund returns after fees" for additional information regarding performance/return information.